

Purchase indicators of Plastics, Crude Oil, Rubber, Cotton, Sea freight, Currencies, Inflation Year, China Export rebates and China VAT
Europe Plastics prices: In July, PS (normal/clear) -4.5%, LLDPE (foil) -6.2%, PVC (foil) -7.1%, PC (clear bright) -8.8%. Original: https://www.plasticportal.eu/ Unit: EUR/Ton
| Indicator | Aug-23 | Sep-23 | Oct-23 | Nov-23 | Dec-23 | Jan-24 | Feb-24 | Mar-24 | Apr-24 | May-24 | Jun-24 | Jul-24 |
| PS (normal/clear) | 1,630 | 1,770 | 1,850 | 1,700 | 1,610 | 1,600 | 1,800 | 2,020 | 2,000 | 1,980 | 1,980 | 1,890 |
| HDPE (injection) | 1,260 | 1,350 | 1,430 | 1,340 | 1,310 | 1,250 | 1,310 | 1,430 | 1,310 | 1,340 | 1,340 | 1,390 |
| LLDPE (foil) | 1,270 | 1,380 | 1,470 | 1,390 | 1,370 | 1,290 | 1,370 | 1,440 | 1,310 | 1,290 | 1,290 | 1,210 |
| LDPE (foil) | 1,490 | 1,560 | 1,670 | 1,560 | 1,520 | 1,280 | 1,470 | 1,550 | 1,310 | 1,300 | 1,300 | 1,280 |
| PVC (foil) | 1,280 | 1,300 | 1,340 | 1,240 | 1,220 | 1,240 | 1,040 | 1,050 | 1,120 | 1,140 | 1,120 | 1,040 |
| ABS (natural) | 1,870 | 1,970 | 2,000 | 1,860 | 1,820 | 2,200 | 2,130 | 2,265 | 2,300 | 2,330 | 2,330 | 2,380 |
| PC (clear bright) | 4,050 | 4,050 | 4,150 | 4,030 | 3,980 | 3,600 | 3,530 | 3,530 | 3,530 | 3,530 | 3,530 | 3,220 |
| PP (homo) | 1,230 | 1,320 | 1,410 | 1,300 | 1,290 | 1,350 | 1,450 | 1,540 | 1,350 | 1,400 | 1,400 | 1,400 |
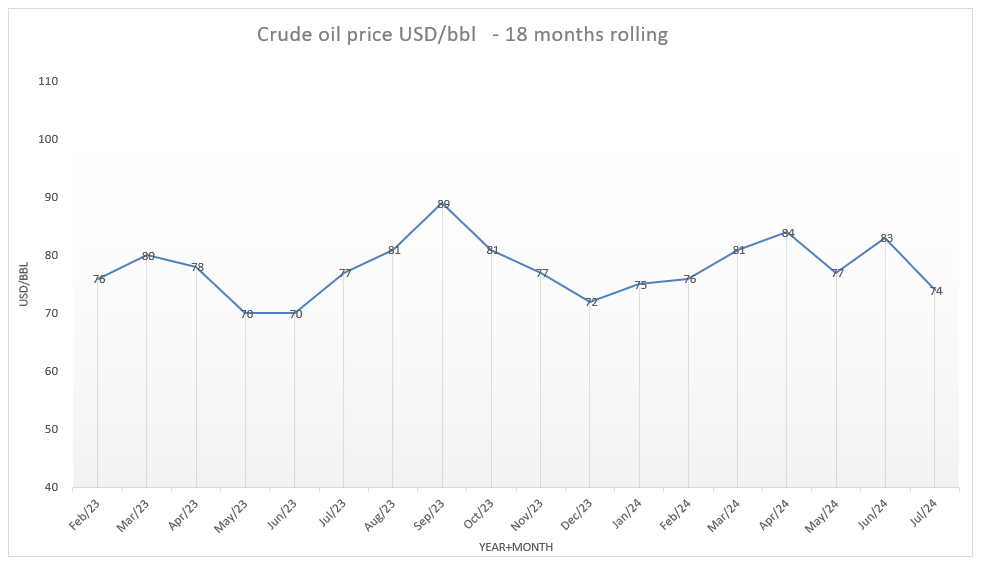
Crude Oil: price dropped from USD 83/bbl to USD 74/bbl in July (-10.8%).
- Increase in oil production from U.S. and some OPEC+ members which boost supply.
- Slower economic growth (China, Europe), leading to weaker oil demand concerns.
- The USA released additional crude oil from their strategic reserves to stabilize or reduce prices.
- Fears of a potential regional war (Israel, Lebanon, Iran) and stopped production due to political instability (e.g. Lybia’s largest oil field, Sharara, due to anti-government protests and security issues) give some counterweight the price decline.
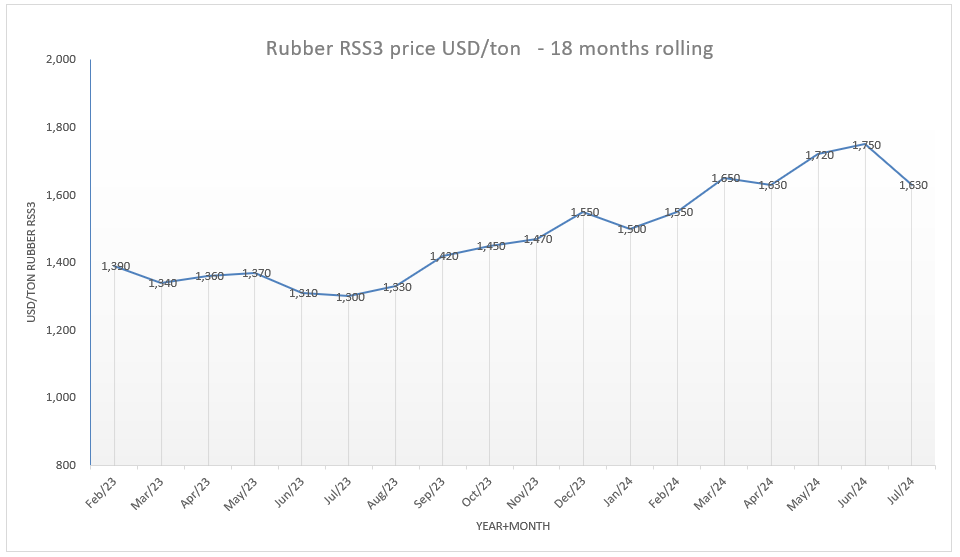
Rubber: declined from USD 1,750/ton to USD 1,630/ton in July (-6.9%, USD 1,690/ton today), as concerns over global tight supplies.
- China’s manufacturing activity fell for a third consecutive month in July, depressing demand outlooks.
Cotton: Declined from USD 1,540/ton to USD 1,500/ton in July (-2.6%, 1,450/ton as of today) due to falling oil prices and heavy selling pressure in agricultural commodities.
- Global cotton production is projected to grow steadily, reaching 29 million tons by 2033, a 17% increase from the 2021-23 base period, with India accounting for 38%, United States at 27% and Brazil at 21% (OECD-FAO Agricultural Outlook 2024-2033′ report).
| Indicator | Aug-23 | Sep-23 | Oct-23 | Nov-23 | Dec-23 | Jan-24 | Feb-24 | Mar-24 | Apr-24 | May-24 | Jun-24 | Jul-24 |
| Crude oil (USD/bbl) | 81 | 89 | 81 | 77 | 72 | 75 | 76 | 81 | 84 | 77 | 83 | 74 |
| Rubber RSS3 (USD/ton) | 1,330 | 1,420 | 1,450 | 1,470 | 1,550 | 1,500 | 1,550 | 1,650 | 1,630 | 1,720 | 1,750 | 1,630 |
| Cotton (input for CAB)
( USD/ton) |
1,880 | 1,880 | 1,850 | 1,750 | 1,760 | 1,830 | 2,000 | 2,000 | 1,830 | 1,730 | 1,540 | 1,500 |
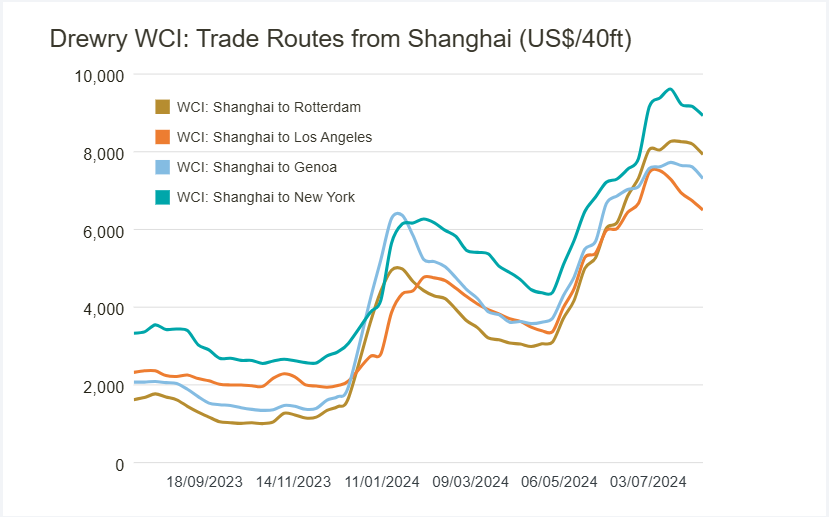
Sea freight indicators: Original: Original: https://www.drewry.co.uk/
Shanghai – Rotterdam: increased from USD 6,500/40FT to USD 8,000/40FT (+23%)
Shanghai – Los Angeles(A/C): increased from USD 6,200/40FT to USD 7,300/40FT (+17.7%).
- The US National Retail Federation point out that the consumer goods shipments will peak in August and the peak season to Europe might be earlier. Asia-Europe utilization levels have slipped recently. Besides the continued Red Sea diversions mean longer transit times and a need for earlier departures (end September instead of 2nd half of October).
- Despite volumes likely reaching their peak, there is still no significant congestion at destination hubs from increased import traffic.
- Congestion is still a factor in Singapore and has led to some spillover to Malaysia. But overall delays have decreased, with vessel wait times under two days in Singapore.
Currencies: Original: www.oanda.com
EUR/USD: remained at 1:1.08 (0%) in July.
EUR/JPY: increased a bit from 1:170.05 to 1:171.12 (+0.6%).
EUR/CNY: increased from 1:7.80 to 1:7.87. (+0.9%).
USD/JPY: decreased from 1: 158.04 to 1:157.71. (-0.2%).
USD/TWD: increased from 1: 32.39 to 1:32.63 (+0.7%).
USD/CNY: increase from 1:7.25 to 1:7.26. (+0.1%).
| Indicator | Aug-23 | Sep-23 | Oct-23 | Nov-23 | Dec-23 | Jan-24 | Feb-24 | Mar-24 | Apr-24 | May-24 | Jun-24 | Jul-24 |
| EUR/USD | 1.09 | 1.07 | 1.06 | 1.08 | 1.09 | 1.09 | 1.08 | 1.09 | 1.07 | 1.08 | 1.08 | 1.08 |
| EUR/JPY | 157.89 | 157.77 | 157.95 | 161.99 | 157.03 | 159.35 | 161.20 | 162.71 | 165.04 | 168.36 | 170.05 | 171.12 |
| EUR/CNY | 7.89 | 7.78 | 7.69 | 7.79 | 7.76 | 7.75 | 7.72 | 7.82 | 7.76 | 7.81 | 7.80 | 7.87 |
| EUR/TWD | 34.70 | 34.20 | 34.10 | 34.48 | 34.08 | 34.01 | 33.88 | 34.41 | 34.67 | 34.90 | 34.84 | 35.40 |
| USD/JPY | 144.74 | 147.72 | 149.54 | 149.84 | 144.08 | 146.06 | 149.44 | 149.77 | 153.94 | 155.76 | 158.04 | 157.71 |
| USD/NT$ | 31.81 | 32.02 | 32.28 | 31.90 | 31.27 | 31.18 | 31.42 | 31.68 | 32.34 | 32.30 | 32.39 | 32.63 |
| USD/CNY | 7.23 | 7.29 | 7.28 | 7.21 | 7.12 | 7.10 | 7.16 | 7.20 | 7.24 | 7.23 | 7.25 | 7.26 |
| EUR/VND | 26,000 | 25,850 | 25,850 | 26,300 | 26,460 | 26,700 | 26,390 | 26,850 | 26,990 | 27,500 | 27,370 | 27,500 |
| USD/THB | 35.00 | 35.79 | 36.47 | 35.44 | 34.97 | 35.15 | 35.84 | 35.94 | 36.75 | 36.60 | 36.71 | 36.23 |
Inflation Year on Year %, China Export rebates and China VAT
| Indicator | Aug-23 | Sep-23 | Oct-23 | Nov-23 | Dec-23 | Jan-24 | Feb-24 | Mar-24 | Apr-24 | May-24 | Jun-24 | Jul-24 |
| Japan Inflation (CPI) YOY % | 3.20% | 3.00% | 3.30% | 2.80% | 2.60% | 2.20% | 2.80% | 2.70% | 2.50% | 2.80% | 2.80% | |
| Taiwan Inflation (CPI) YOY % | 2.52% | 2.93% | 3.05% | 2.90% | 2.71% | 1.79% | 3.08% | 2.14% | 1.95% | 2.24% | 2.42% | |
| China Inflation (CPI) YOY % | 0.10% | 0.00% | -0.20% | -0.50% | -0.30% | -0.80% | 0.70% | 0.10% | 0.30% | 0.30% | 0.20% | |
| Vietnam Inflation (CPI) YOY % | 2.96% | 3.66% | 3.59% | 3.45% | 3.58% | 3.37% | 3.98% | 3.97% | 4.40% | 4.44% | 4.34% | 4.36% |
| China Export rebates | 13% | 13% | 13% | 13% | 13% | 13% | 13% | 13% | 13% | 13% | 13% | 13% |
| China VAT | 13% | 13% | 13% | 13% | 13% | 13% | 13% | 13% | 13% | 13% | 13% | 13% |


Leave a Reply
Want to join the discussion?Feel free to contribute!