

February 2025 Purchase indicators of Plastics, Crude Oil, Rubber, Cotton, Sea freight, Currencies, Inflation Year, China Export rebates and China VAT
February 2025 Purchase indicators of Plastics, Crude Oil, Rubber, Cotton, Sea freight, Currencies, Inflation Year, China Export rebates and China VAT
The Electric bike industry February 2025 purchase indicators are like below:
Plastics LDPE (foil) increased by 6.6%, crude oil decreased by 7.9%, cotton decreased by 4.7%.
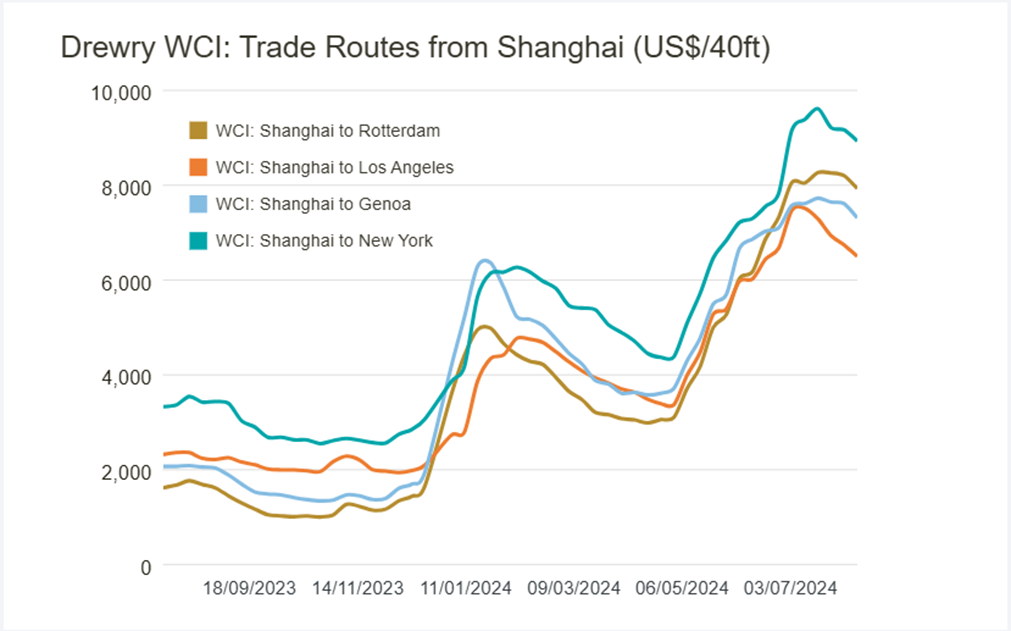
The container freight rates from China to Europe decreased around 19%~28%, and China to USA rates decreased by around 13%~18% in February.
Europe Plastics prices: LDPE (foil) increased 6.6% in February, other plastics prices remained stable.
Original: https://www.plasticportal.eu/ Unit: EUR/Ton
| Indicator | Mar.-24 | Apr.-24 | May-24 | Jun.-24 | Jul.-24 | Aug.-24 | Sep.-24 | Oct.-24 | Nov.-24 | Dec.-24 | Jan.-25 | Feb.-25 |
| PS (normal/clear) | 2,020 | 2,000 | 1,980 | 1,980 | 1,890 | 1,830 | 1,840 | 1,600 | 1,650 | 1,650 | 1,660 | 1,640 |
| HDPE (injection) | 1,430 | 1,310 | 1,340 | 1,340 | 1,390 | 1,280 | 1,460 | 1,360 | 1,240 | 1,320 | 1,300 | 1,310 |
| LLDPE (foil) | 1,440 | 1,310 | 1,290 | 1,290 | 1,210 | 1,320 | 1,350 | 1,290 | 1,190 | 1,230 | 1,300 | 1,340 |
| LDPE (foil) | 1,550 | 1,310 | 1,300 | 1,300 | 1,280 | 1,380 | 1,410 | 1,360 | 1,280 | 1,310 | 1,370 | 1,460 |
| PVC (foil) | 1,050 | 1,120 | 1,140 | 1,120 | 1,040 | 1,065 | 1,055 | 1,055 | 975 | 975 | 965 | 965 |
| ABS (natural) | 2,265 | 2,300 | 2,330 | 2,330 | 2,380 | 2,340 | 2,330 | 2,230 | 2,250 | 2,210 | 2,230 | 2,250 |
| PC (clear bright) | 3,530 | 3,530 | 3,530 | 3,530 | 3,220 | 3,410 | 3,380 | 3,330 | 3,220 | 3,260 | 3,350 | 3,410 |
| PP (homo) | 1,540 | 1,350 | 1,400 | 1,400 | 1,400 | 1,460 | 1,510 | 1,410 | 1,380 | 1,400 | 1,420 | 1,460 |
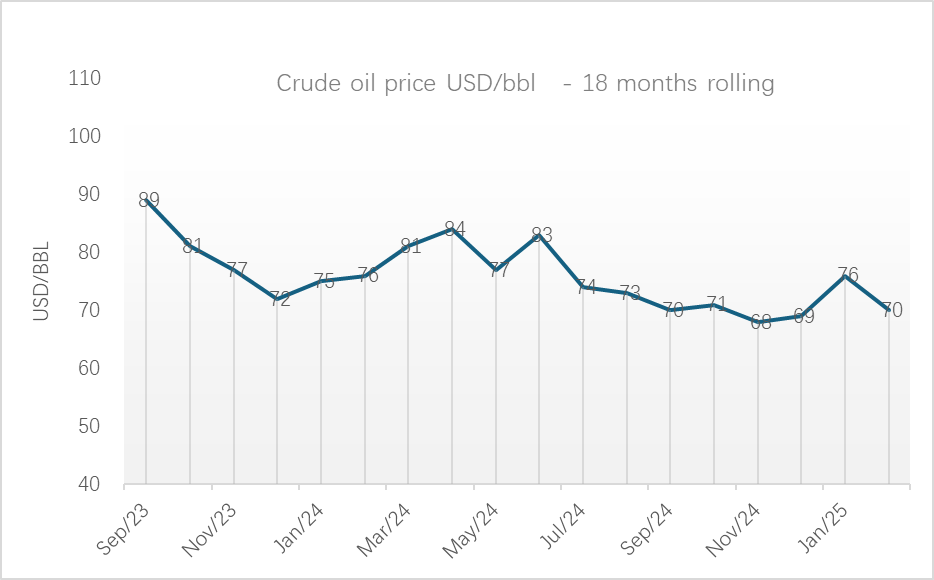
Oil: price declined from USD 76/bbl to USD 70/bbl in February (-7.9%, ~USD 67/bbl today).
- Prices came under pressure from the potential fallout of global trade shifts.
- While President Donald Trump eased some tariffs on Mexico and Canada until April 2, Canada’s retaliatory tariffs remain, and China’s also take countermeasures.
- OPEC+ plans to revive output in April, coinciding with prospects of a restart of the Kirkuk-Ceyhan pipeline and increased production at Kazakhstan’s Tengiz field.
- Russian President signaled interest in a Ukraine peace deal, raising the prospect of sanctions relief and higher Russian oil exports.
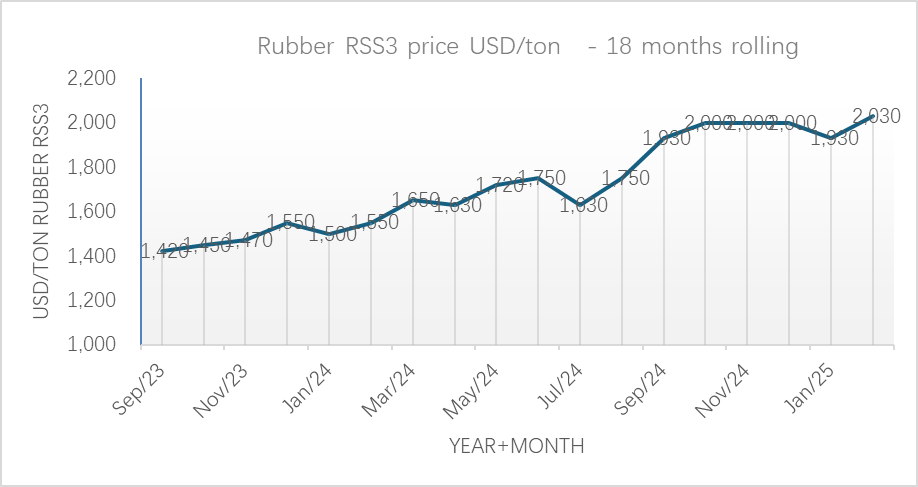
Rubber: Rubber: price increased from USD 1,930/ton to USD 2,030 in February (+5.2%, USD 2,030/ton today).
Cotton: price drop from USD 1,500/ton to USD 1,430/ton in February (-4.7%, 1,470/ton as of today).
- Concerns about US trade policies.
- The USDA reported an increase in upland cotton net sales.
- Improved demand was noted, with expectations for strong sales from March through May.
- Overall, market sentiment showed signs of recovery after a prolonged bearish trend.
| Indicator | Mar.-24 | Apr.-24 | May-24 | Jun.-24 | Jul.-24 | Aug.-24 | Sep.-24 | Oct.-24 | Nov.-24 | Dec.-24 | Jan.-25 | Feb.-25 |
| Crude oil (USD/bbl) | 81 | 84 | 77 | 83 | 74 | 73 | 70 | 71 | 68 | 69 | 76 | 70 |
| Rubber RSS3 (USD/ton) | 1,650 | 1,630 | 1,720 | 1,750 | 1,630 | 1,750 | 1,930 | 2,000 | 2,000 | 2,000 | 1,930 | 2,030 |
| Cotton (input for CAB)
( USD/ton) |
2,000 | 1,830 | 1,730 | 1,540 | 1,500 | 1,500 | 1,560 | 1,560 | 1,560 | 1,540 | 1,500 | 1,430 |
Sea freight in February:
China – Europe: decreased from USD 2,100/20FT to USD 1,700/20FT (-19%)
Shanghai – Europe: decreased from USD 2,230/20FT to USD 1,600/20FT (-28.3%).
China – US Westcoast: increased from USD 1,100/20FT to USD 960/20FT (-12.7%).
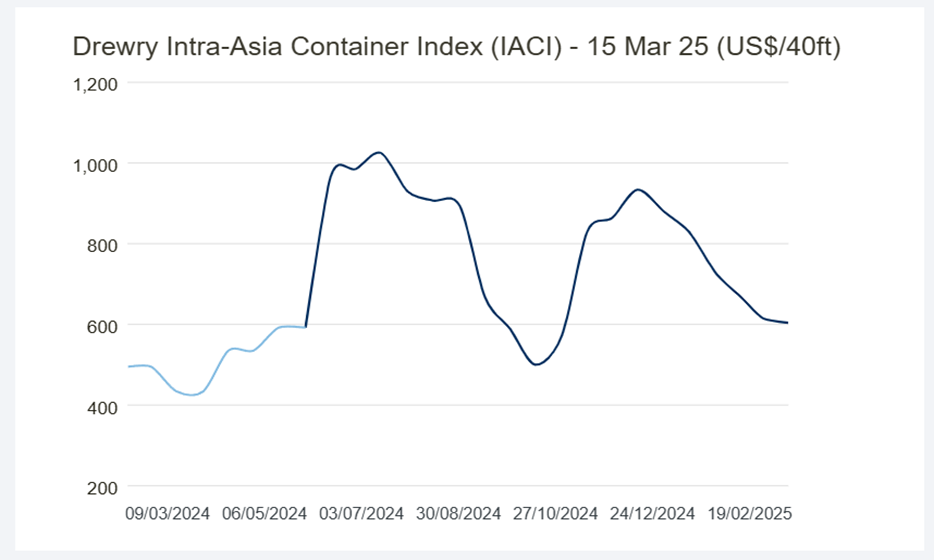
Intra-Asia: decreased from USD800/40FT to USD 670/40FT
- The combination of a seasonal slump in demand and the possible end of frontloading likely drove the sharp fall in transpacific ocean rates.
• Tariffs driving up inflation and negatively impacting consumer spending could also push down demand for ocean freight in H2.
Currencies: Original: www.oanda.com
Currencies:
EUR/USD: increase from 1:1.03 to 1:1.04(+0.97%).
EUR/JPY:decreased from 1: 162.02 to 1:158.05 (-2.5%).
EUR/CNY: stay at 1:7.56. (0%), increased to 1:7.84 today
USD/JPY: decreased from 1:156.57 to 1:151.79. (-3%).
USD/TWD: decreased from 1:32.86 to 1:32.79 (-0.2%).
USD/CNY: decrease from 1:7.3 to 1:7.26 (-0.55%).
| Indicator | Mar.-24 | Apr.-24 | May-24 | Jun.-24 | Jul.-24 | Aug.-24 | Sep.r-24 | Oct.-24 | Nov.r-24 | Dec.-24 | Jan.-25 | Feb.-25 |
| EUR/USD | 1.09 | 1.07 | 1.08 | 1.08 | 1.08 | 1.10 | 1.11 | 1.09 | 1.06 | 1.05 | 1.03 | 1.04 |
| EUR/JPY | 162.71 | 165.04 | 168.36 | 170.05 | 171.12 | 161.46 | 158.87 | 163.22 | 163.10 | 161.22 | 162.02 | 158.05 |
| EUR/CNY | 7.82 | 7.76 | 7.81 | 7.80 | 7.87 | 7.87 | 7.86 | 7.73 | 7.65 | 7.63 | 7.56 | 7.56 |
| EUR/TWD | 34.41 | 34.67 | 34.90 | 34.84 | 35.40 | 35.50 | 35.47 | 34.98 | 34.36 | 34.11 | 34.00 | 34.14 |
| USD/JPY | 149.77 | 153.94 | 155.76 | 158.04 | 157.71 | 146.24 | 142.84 | 149.77 | 153.48 | 153.91 | 156.57 | 151.79 |
| USD/NT$ | 31.68 | 32.34 | 32.30 | 32.39 | 32.63 | 32.23 | 31.94 | 32.10 | 32.34 | 32.57 | 32.86 | 32.79 |
| USD/CNY | 7.20 | 7.24 | 7.23 | 7.25 | 7.26 | 7.15 | 7.07 | 7.09 | 7.20 | 7.28 | 7.30 | 7.26 |
| EUR/VND | 26,850 | 26,990 | 27,500 | 27,370 | 27,500 | 27,600 | 27,350 | 27,280 | 26,930 | 26,620 | 26,150 | 26,400 |
| USD/THB | 35.94 | 36.75 | 36.60 | 36.71 | 36.23 | 34.71 | 33.26 | 33.35 | 34.39 | 34.13 | 34.25 | 33.75 |
Inflation Year on Year %, China Export rebates and China VAT
| Indicator | Mar.-24 | Apr.-24 | May-24 | Jun.-24 | Jul.-24 | Aug.-24 | Sep.-24 | Oct.-24 | Nov.-24 | Dec.-24 | Jan.-25 | Feb.-25 |
| Japan Inflation (CPI) YOY % | 2.70% | 2.50% | 2.80% | 2.80% | 2.80% | 3.00% | 2.50% | 2.30% | 2.90% | 3.60% | 4.00% | |
| Taiwan Inflation (CPI) YOY % | 2.14% | 1.95% | 2.24% | 2.42% | 2.52% | 2.36% | 1.82% | 1.69% | 2.08% | 2.10% | 2.66% | |
| China Inflation (CPI) YOY % | 0.10% | 0.30% | 0.30% | 0.20% | 0.50% | 0.60% | 0.40% | 0.30% | 0.20% | 0.10% | 0.50% | |
| Vietnam Inflation (CPI) YOY % | 3.97% | 4.40% | 4.44% | 4.34% | 4.36% | 3.45% | 2.63% | 2.89% | 2.77% | 2.94% | 3.63% | 2.91% |
| China Export rebates | 13% | 13% | 13% | 13% | 13% | 13% | 13% | 13% | 13% | 13% | 13% | 13% |
| China VAT | 13% | 13% | 13% | 13% | 13% | 13% | 13% | 13% | 13% | 13% | 13% | 13% |


Leave a Reply
Want to join the discussion?Feel free to contribute!