https://www.vehicooltech.com/wp-content/uploads/2024/08/UN-comtrade-China-export-data.jpeg679947vehicool@comhttps://www.vehicooltech.com/wp-content/uploads/2025/03/20190506-VEHICOOL-01.pngvehicool@com2024-08-15 09:47:262024-09-19 09:38:31The China Export Data of E-bike to worldwide
Europe Plastics prices: In July, PS (normal/clear) -4.5%, LLDPE (foil) -6.2%, PVC (foil) -7.1%, PC (clear bright) -8.8%. Original: https://www.plasticportal.eu/ Unit: EUR/Ton
Indicator
Aug-23
Sep-23
Oct-23
Nov-23
Dec-23
Jan-24
Feb-24
Mar-24
Apr-24
May-24
Jun-24
Jul-24
PS (normal/clear)
1,630
1,770
1,850
1,700
1,610
1,600
1,800
2,020
2,000
1,980
1,980
1,890
HDPE (injection)
1,260
1,350
1,430
1,340
1,310
1,250
1,310
1,430
1,310
1,340
1,340
1,390
LLDPE (foil)
1,270
1,380
1,470
1,390
1,370
1,290
1,370
1,440
1,310
1,290
1,290
1,210
LDPE (foil)
1,490
1,560
1,670
1,560
1,520
1,280
1,470
1,550
1,310
1,300
1,300
1,280
PVC (foil)
1,280
1,300
1,340
1,240
1,220
1,240
1,040
1,050
1,120
1,140
1,120
1,040
ABS (natural)
1,870
1,970
2,000
1,860
1,820
2,200
2,130
2,265
2,300
2,330
2,330
2,380
PC (clear bright)
4,050
4,050
4,150
4,030
3,980
3,600
3,530
3,530
3,530
3,530
3,530
3,220
PP (homo)
1,230
1,320
1,410
1,300
1,290
1,350
1,450
1,540
1,350
1,400
1,400
1,400
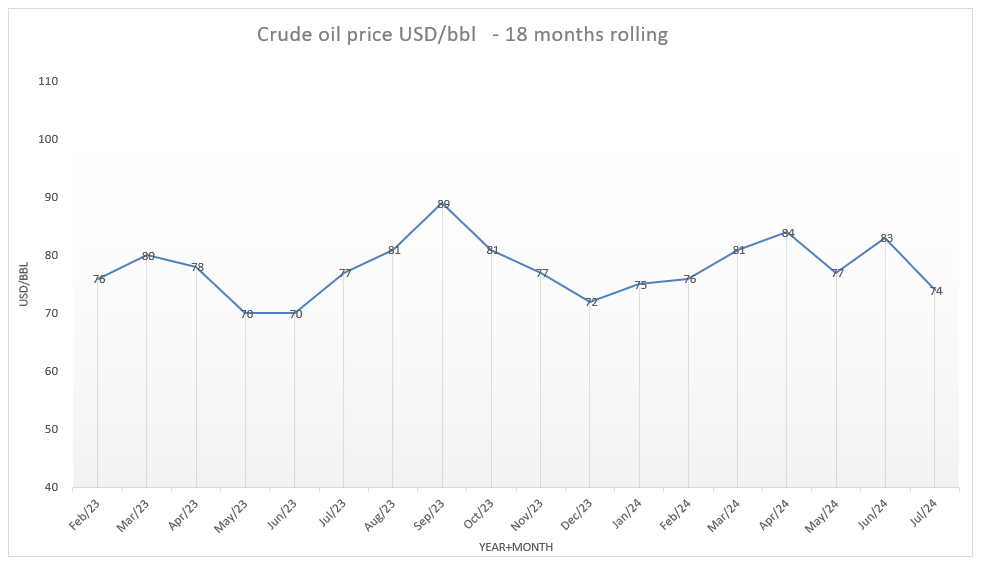
Crude Oil: price dropped from USD 83/bbl to USD 74/bbl in July (-10.8%).
Increase in oil production from U.S. and some OPEC+ members which boost supply.
Slower economic growth (China, Europe), leading to weaker oil demand concerns.
The USA released additional crude oil from their strategic reserves to stabilize or reduce prices.
Fears of a potential regional war (Israel, Lebanon, Iran) and stopped production due to political instability (e.g. Lybia’s largest oil field, Sharara, due to anti-government protests and security issues) give some counterweight the price decline.
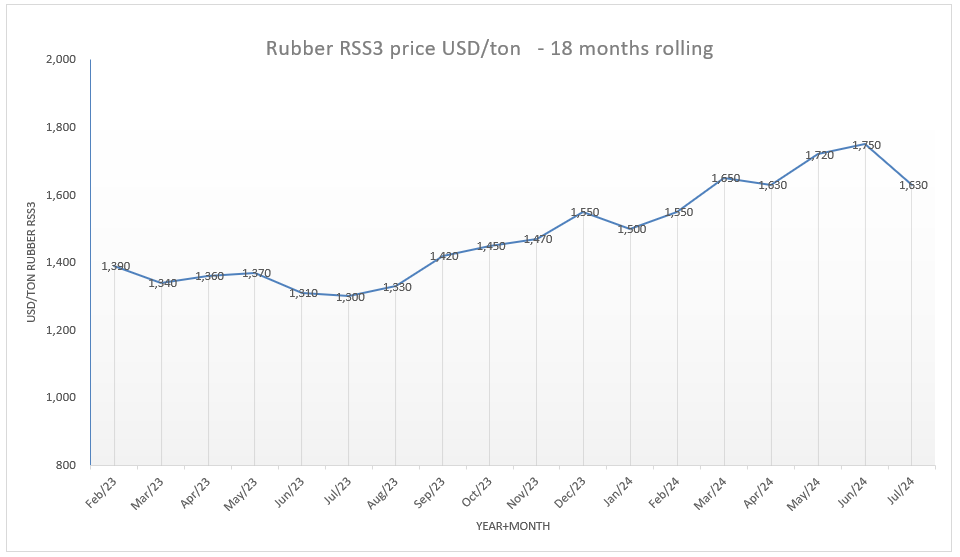
Rubber: declined from USD 1,750/ton to USD 1,630/ton in July (-6.9%, USD 1,690/ton today), as concerns over global tight supplies.
China’s manufacturing activity fell for a third consecutive month in July, depressing demand outlooks.
Cotton: Declined from USD 1,540/ton to USD 1,500/ton in July (-2.6%, 1,450/ton as of today) due to falling oil prices and heavy selling pressure in agricultural commodities.
Global cotton production is projected to grow steadily, reaching 29 million tons by 2033, a 17% increase from the 2021-23 base period, with India accounting for 38%, United States at 27% and Brazil at 21% (OECD-FAO Agricultural Outlook 2024-2033′ report).
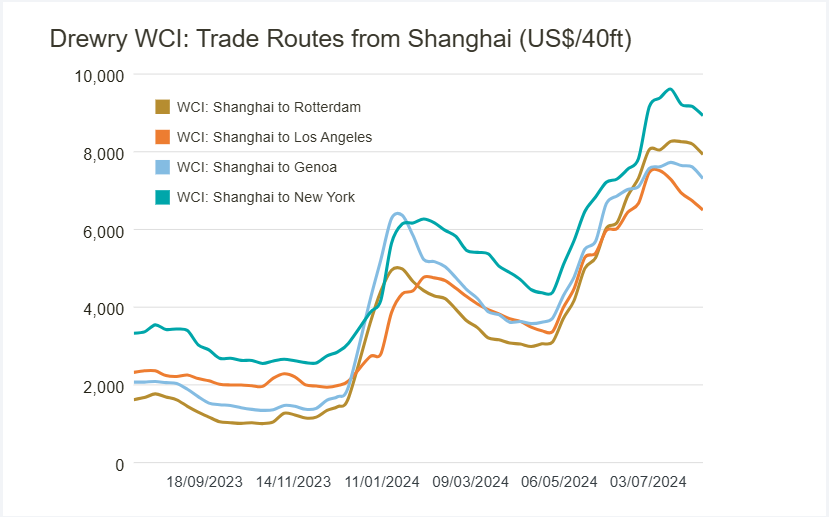
Shanghai – Rotterdam: increased from USD 6,500/40FT to USD 8,000/40FT (+23%)
Shanghai – Los Angeles(A/C): increased from USD 6,200/40FT to USD 7,300/40FT (+17.7%).
The US National Retail Federation point out that the consumer goods shipments will peak in August and the peak season to Europe might be earlier. Asia-Europe utilization levels have slipped recently. Besides the continued Red Sea diversions mean longer transit times and a need for earlier departures (end September instead of 2nd half of October).
Despite volumes likely reaching their peak, there is still no significant congestion at destination hubs from increased import traffic.
Congestion is still a factor in Singapore and has led to some spillover to Malaysia. But overall delays have decreased, with vessel wait times under two days in Singapore.
EUR/USD: remained at 1:1.08 (0%) in July.
EUR/JPY: increased a bit from 1:170.05 to 1:171.12 (+0.6%).
EUR/CNY: increased from 1:7.80 to 1:7.87. (+0.9%).
USD/JPY: decreased from 1: 158.04 to 1:157.71. (-0.2%).
USD/TWD: increased from 1: 32.39 to 1:32.63 (+0.7%).
USD/CNY: increase from 1:7.25 to 1:7.26. (+0.1%).
Indicator
Aug-23
Sep-23
Oct-23
Nov-23
Dec-23
Jan-24
Feb-24
Mar-24
Apr-24
May-24
Jun-24
Jul-24
EUR/USD
1.09
1.07
1.06
1.08
1.09
1.09
1.08
1.09
1.07
1.08
1.08
1.08
EUR/JPY
157.89
157.77
157.95
161.99
157.03
159.35
161.20
162.71
165.04
168.36
170.05
171.12
EUR/CNY
7.89
7.78
7.69
7.79
7.76
7.75
7.72
7.82
7.76
7.81
7.80
7.87
EUR/TWD
34.70
34.20
34.10
34.48
34.08
34.01
33.88
34.41
34.67
34.90
34.84
35.40
USD/JPY
144.74
147.72
149.54
149.84
144.08
146.06
149.44
149.77
153.94
155.76
158.04
157.71
USD/NT$
31.81
32.02
32.28
31.90
31.27
31.18
31.42
31.68
32.34
32.30
32.39
32.63
USD/CNY
7.23
7.29
7.28
7.21
7.12
7.10
7.16
7.20
7.24
7.23
7.25
7.26
EUR/VND
26,000
25,850
25,850
26,300
26,460
26,700
26,390
26,850
26,990
27,500
27,370
27,500
USD/THB
35.00
35.79
36.47
35.44
34.97
35.15
35.84
35.94
36.75
36.60
36.71
36.23
Inflation Year on Year %, China Export rebates and China VAT
Indicator
Aug-23
Sep-23
Oct-23
Nov-23
Dec-23
Jan-24
Feb-24
Mar-24
Apr-24
May-24
Jun-24
Jul-24
Japan Inflation (CPI) YOY %
3.20%
3.00%
3.30%
2.80%
2.60%
2.20%
2.80%
2.70%
2.50%
2.80%
2.80%
Taiwan Inflation (CPI) YOY %
2.52%
2.93%
3.05%
2.90%
2.71%
1.79%
3.08%
2.14%
1.95%
2.24%
2.42%
China Inflation (CPI) YOY %
0.10%
0.00%
-0.20%
-0.50%
-0.30%
-0.80%
0.70%
0.10%
0.30%
0.30%
0.20%
Vietnam Inflation (CPI) YOY %
2.96%
3.66%
3.59%
3.45%
3.58%
3.37%
3.98%
3.97%
4.40%
4.44%
4.34%
4.36%
China Export rebates
13%
13%
13%
13%
13%
13%
13%
13%
13%
13%
13%
13%
China VAT
13%
13%
13%
13%
13%
13%
13%
13%
13%
13%
13%
13%
https://www.vehicooltech.com/wp-content/uploads/2024/08/plastics.png14122122vehicool@comhttps://www.vehicooltech.com/wp-content/uploads/2025/03/20190506-VEHICOOL-01.pngvehicool@com2024-08-15 03:54:352024-08-15 03:59:39Purchase indicators of Plastics, Crude Oil, Rubber, Cotton, Sea freight, Currencies, Inflation Year, China Export rebates and China VAT
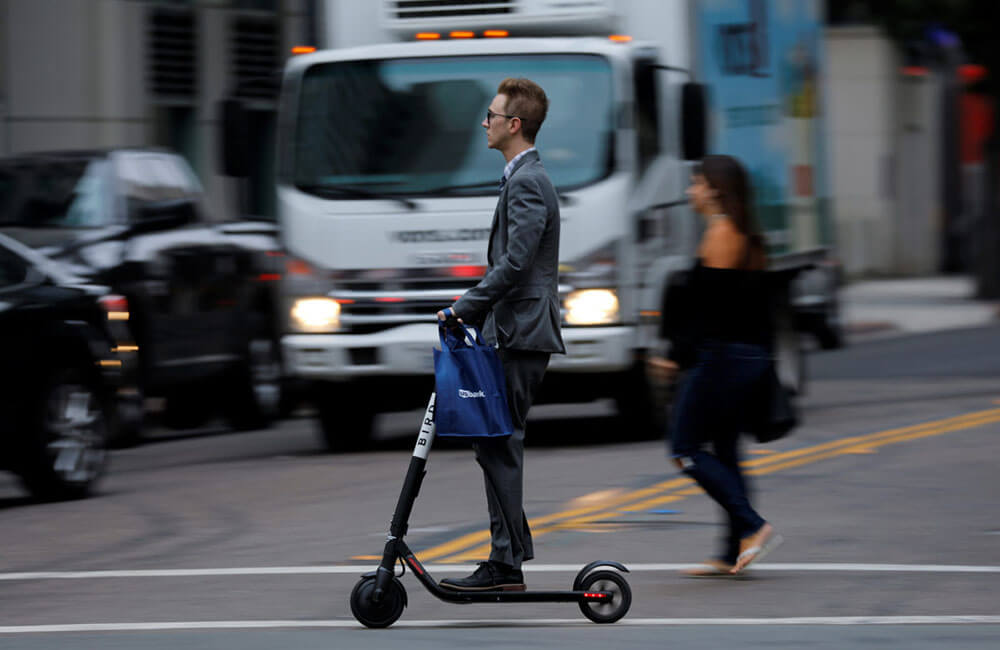
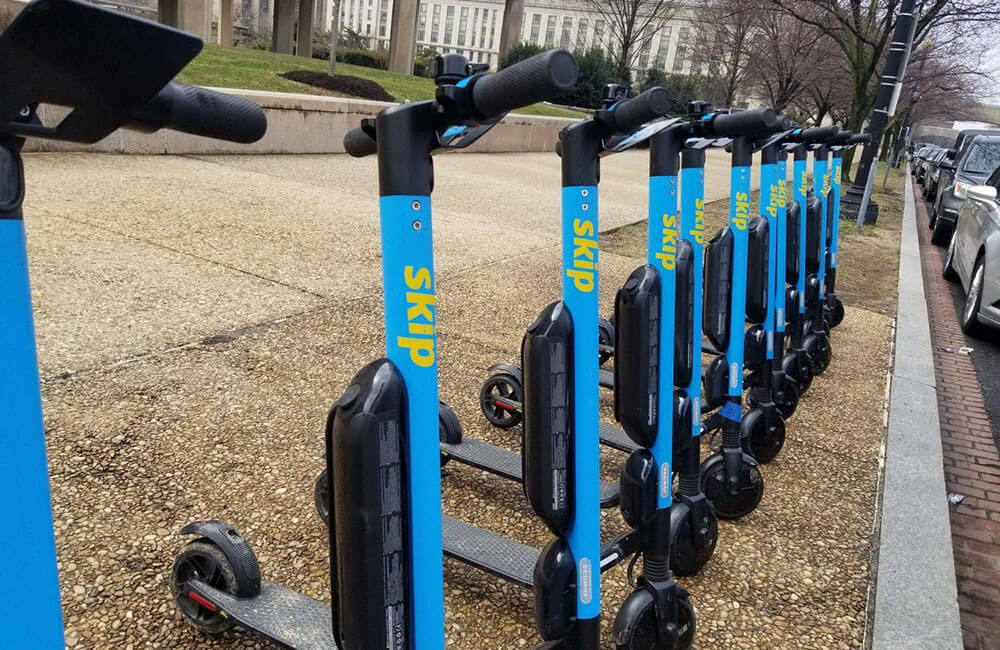
The electric scooter market is zooming. Will profits
catch up?
Investors are
pouring their money into electric scooter companies like Bird, one of the
fastest-growing startups in history.
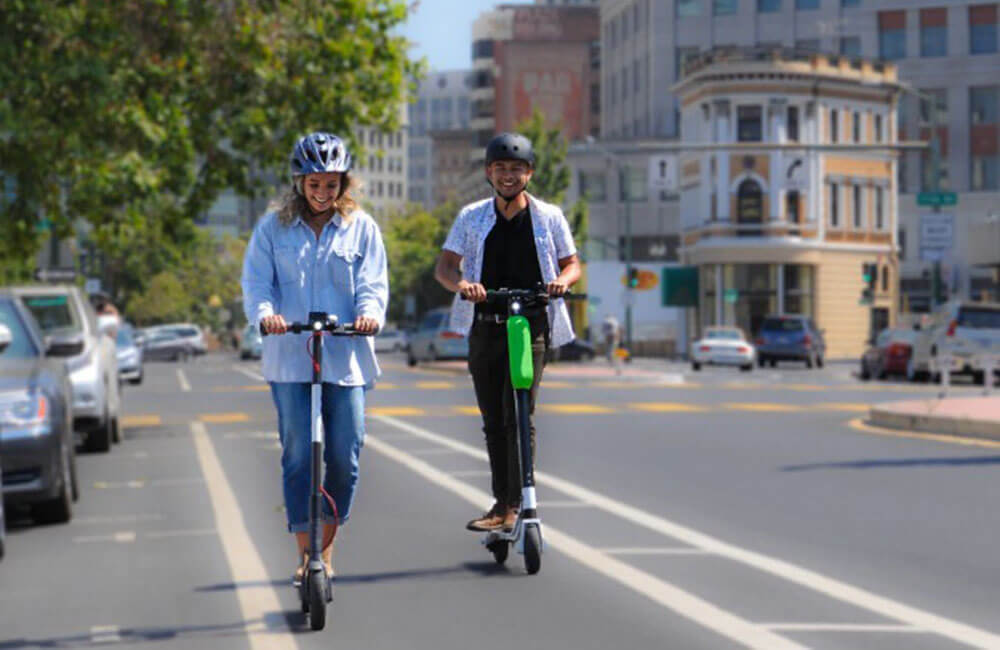
Marketed as
eco-friendly alternatives to cars, scooters can help urban consumers bridge the
“first and last mile,” the short distance between commuters’ homes and
workplaces and larger transportation hubs, such as bus terminals or subway
stations.
WATCH: Why the rise of the electric scooter has been a bumpy ride
The scooters are
already on the streets in dozens of cities in the U.S., Canada and Europe.
Bird, the first of the major electric scooter companies to launch in the U.S.,
is valued at $2 billion.
But will all the
hype — and billions of dollars in investment — be supported by the business
model?
That depends on whom you ask and what numbers you are using. Data leaked to The Information shows Bird has a 19 percent profit margin on its scooters, but that does not cover the cost of replacing the scooters or the cost of management and advertising. Adding those in could make the entire business unprofitable.
So how is a
company like Bird valued at $2 billion?
The same question could be asked of electric car company Tesla, which is valued at $58 billion and has never had a profitable year. Or Twitter, which is valued at $25 billion, but only had its first profitable quarter in its 12-year history in February.
Sometimes, “the
math doesn’t make sense,” said Harry Alford, the co-founder of the venture
development firm Humble Ventures.
The main reason
for the disconnect is that investors are betting on future profits, not what a
company is making today.
Alford said when companies are just getting off the ground, there are often no profits to assess. Instead, investors look at the quality of three things: the management team, the current product and the market for that product.
When competition
is fierce
The market for a
product is key. So is being the first to market.
“You really have
to think about where you are going to be distributing your product or service
before the incumbents figure out what you are even doing,” Alford said.
The scooter market is a good example. Bird launched its scooters in September of 2017. A host of companies–Lime, Scoot, Spin, Lyft and Uber–quickly followed suit, debuting their own two-wheeled ventures this year. (Uber operates JUMP scooters and recently bought a share of Lime. Ford Motor Company announced this week it is buying Spin.)
Now it’s a
battle to see who can grab the most market share as companies drop thousands of
scooters on the streets for consumers to try.
Bird and Lime
operate in dozens of mid- to large-sized cities across the country. JUMP and
Lyft’s operations are limited to a few locations.
The
companies’ markets often overlap, creating fierce competition. All four
companies operate in Santa Monica, California, for example.
“These are
network businesses whose competitiveness improves with scale,” i.e. increasing
the size of the operation, said Juan Matute, the deputy director of the UCLA
Institute of Transportation Studies.
The more
scooters a company has on the street, the more likely people are to use that
company’s app on a regular basis, and that builds customer loyalty, which
boosts profits.
When the profits don’t come in
But expansion
does not automatically mean profit. Often, the profits never come.
Investors lose
trust that they will make their money back and stop injecting capital, the cash
needed to operate its business drys up and the company goes belly up.
This is not at
all unusual. After all, nine out of 10 startups fail.
Plus, all of
those scooters also come with liabilities, which the companies, and their
investors, must take into consideration.
San Francisco and Denver temporarily banned scooters until they could establish regulations.
Bird and Lime have been named in a class-action lawsuit that alleges their negligence led to both riders and pedestrians being injured.
So far, investors still see the potential for profit despite the setbacks.
Keeping an eye on the next big thing
Investors are
also looking for companies that are forward-thinking. Remember, the value of a
company is all about the future — future profits, that is.
Bird has told
investors it is looking for ways to boost its profit margins by reducing the
cost of charging the electric-powered scooters and by lengthening the lifespan
of the scooters, which cost about $550 each to replace based on The
Information’s data.
Lyft and
Uber, which are both planning to go public next year, jumped into the scooter
market when they saw the potential for profits.
Andrew
Savage, the vice president at Lime, told the PBS NewsHour that its business
model has been focused on solving the “first and last mile” transportation
issues. But he said Lime is already looking down the road to deliver a “second
and third mile” solution.
“We’re still
a young company. We’re still evolving and developing new products that will
help solve the suite of issues that cities are facing around the country and
globe,” Savage said.
Lime announced this week that it is launching a car-share program in Seattle.
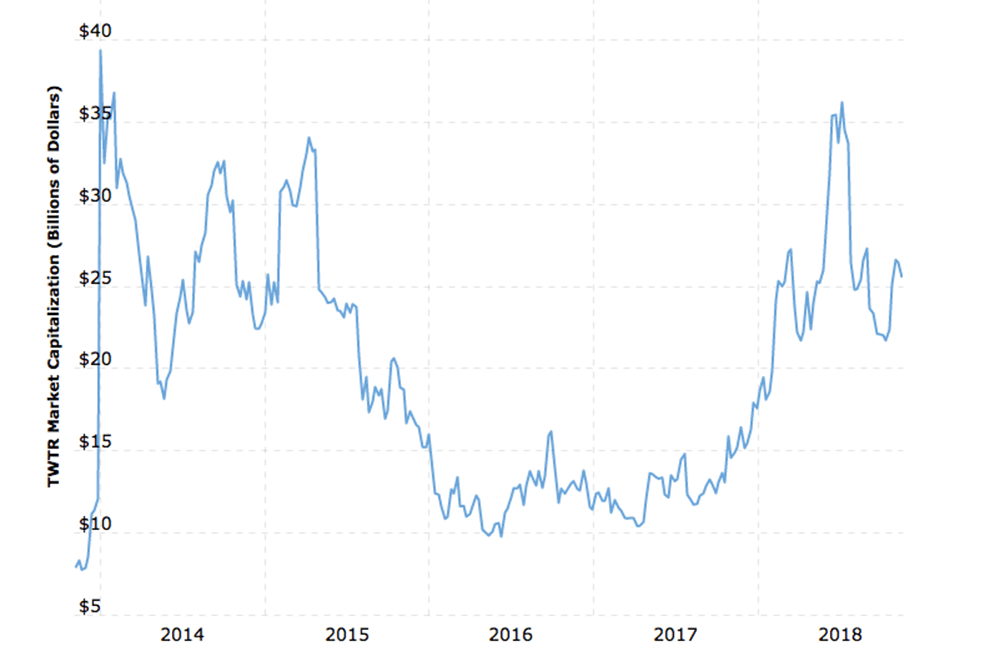
Valuations
are different for private companies as opposed to those publicly owned on the
stock exchange. A publicly owned company’s “market cap” valuation, which is
based on its stock price and is calculated differently than private company
valuations, can change daily.
Take this Macro Trends chart of Twitter’s market cap for example:
The value
changes when stockholders react to any kind of news they think could benefit or
hurt the company’s future profits. A quarterly earnings report that shows a
company is bringing in more revenue, for example, might give investors more
incentive to buy the stock and boost the company’s value.
Alford
cautions that even long stretches of losses do not mean entrepreneurs and
investors should throw in the towel.
“In those
situations, you keep trying to iterate and pivot until you find out that
sustainable solution,” he said.
That could take years — 12 in the case of Twitter. But, in the
end, investors are betting it will be worth the wait.
https://www.vehicooltech.com/wp-content/uploads/2019/11/electric-scooter-market.jpg8001200vehicool@comhttps://www.vehicooltech.com/wp-content/uploads/2025/03/20190506-VEHICOOL-01.pngvehicool@com2019-11-05 08:08:102024-08-15 04:02:00The electric scooter market is zooming. Will profits catch up?
Improve peoples’ lives. Make the world a better place. These are the simple guiding principles that have inspired every VEHICOOL product, technology and solution for nearly 4 years. For most of that time, that’s meant developing innovative consumer technologies and products. Today, as we approach our fouth anniversary, VEHICOOL is in the midst of an ongoing transformation to pursue the vision set forth by our Founder on a much larger scale, providing integrated technology solutions to businesses and municipalities, empowering them to enhance the experiences of their customers and citizens.
Since the founding of our company in 2015, VEHICOOL Technology co., limited have been providing better living for our customers, always making “people” central to our activities, and thus focusing on “people’s lives.” Going forward as well, based on our innovative electric scooters technology, we will provide a wide variety of electric scooters. In various spaces and areas, we will continue to work hard to offer new value for better living, and help realize “A Better Life, A Better World” for each individual customer.
Every moment of every day, people all over the world turn to VEHICOOL to make their lives simpler, more enjoyable, more productive and more secure. Since our founding, we’ve been committed to improving peoples’ live and making the world a better place–one customer, one business, one technological leap forward at a time. VEHICOOL is a High-End Electric Scooters Manufacturer. We offers a great selection of High-End Electric Scooters to customers all over the world! We strive to deliver an extraordinary experience in Safety, Riding and Quality!
“Our main purpose is to manufacture superior products for daily use that improve the quality of life for everyone. From this point on, our full powers will be devoted to this mission.”
VEHICOOL Located in the most famous technology city in China – Shenzhen. VEHICOOL is one of the largest High-End Electric Scooter Manufacturers in China. We are manufacturing the High-End Electric Scooters for more than 4 years.
And while some may still think of us merely as a electric scooters company, we are a global provider of comprehensive solutions for businesses as well as consumers — solutions for your electric scooters design, your electric scooters business and OEM Service.
Our Mission
From the very beginning, VEHICOOL has been dedicated to improving people’s lives and making the world a better place. Doing business with us you will see how our products, technologies and comprehensive solutions are helping to do just that.
Building More Joy and Happiness
Wherever you find VEHICOOL, you find a happy meeting. VEHICOOL’s products, services and enhanced technologies make for a better future for all of us. VEHICOOL has been consistently evolving via innovation and changes to its business culture. VEHICOOL will try to make a happier world by fulfilling its role and responsibility as a civilian company without blind adherence to a short-term profit directive.
Our Future
We look forward to improving our skills and abilities to better serve your needs and your wants. We are excited about the prospect of providing those products and services that will enhance the quality of your life and if we fall short at any time please drop us a line to let us know how we might have done better and we will take actions to correct that in the future. Toward “A Better Life, A Better World”.
Listening to the needs of our customers is our top priority. We work hard to improve our engineering and manufacturing capabilities and to commit ourselves to the pursuit of better lives for people. That is exactly how we at VEHICOOL aspire to bring “A Better Life, A Better World” to each and every customer.
We are taking a new step forward into our next 10 years. Please join us in our endeavors as we continue to advance toward the future.
From the entire team here at VEHICOOL, we wish you good health and abundant prosperity.
https://www.vehicooltech.com/wp-content/uploads/2019/10/A-Better-Life-A-Better-World-a-Manufacturer-with-Heart-2.jpg6501000vehicool@comhttps://www.vehicooltech.com/wp-content/uploads/2025/03/20190506-VEHICOOL-01.pngvehicool@com2019-10-06 11:44:292024-08-15 04:02:11A Better Life, A Better World, a Manufacturer with Heart